Bringing the discipline of quantitative finance to a sector that, until now, has only had editorial narratives.
On top of the chain sits a thirteen-factor, fully explainable scoring model — momentum, money, management and quantum-native dimensions, every conclusion tracing back to a measured source. Built on RBTX's quantum-safe industry research (three primary reports, a 16-table hard-data workbook) and Psi's multi-source live-data engine (27,000+ items, snapshotted point-in-time). The flagship of the same engine — the Quantum-Computing Sector Signal — runs the full model on the listed quantum universe.

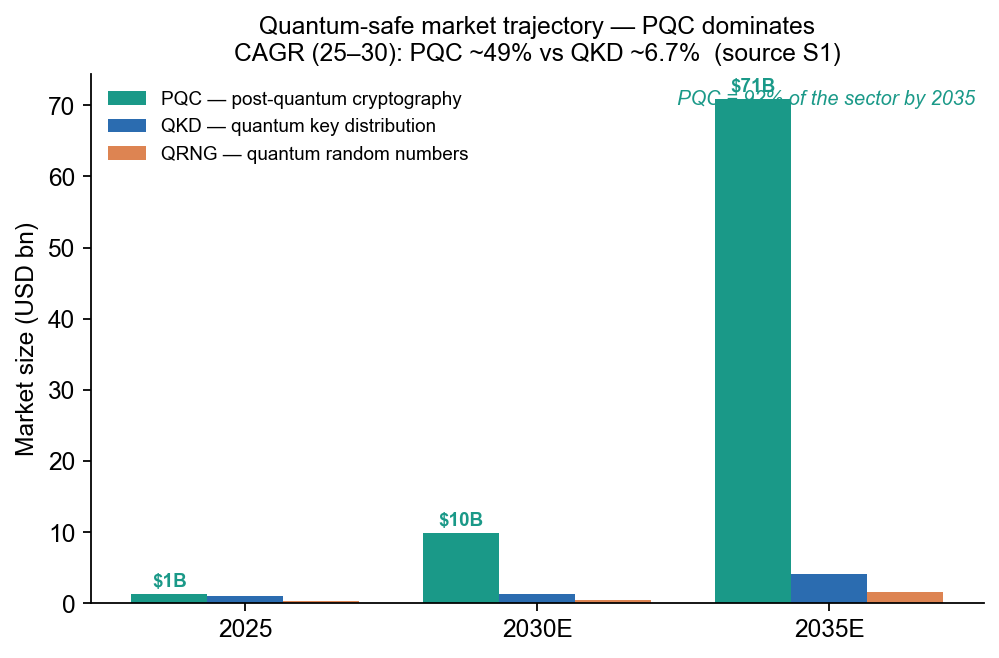
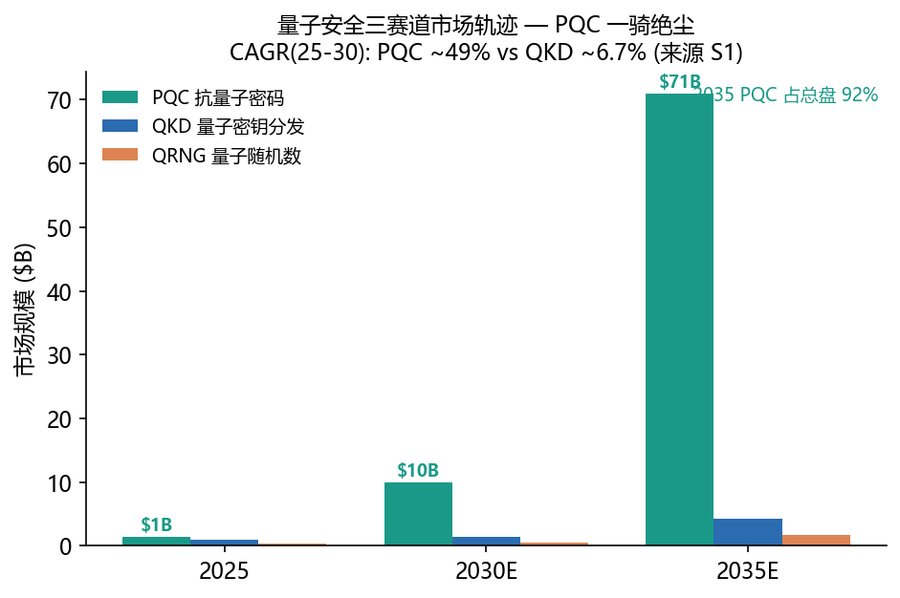
The global quantum-safe market runs from about USD 2.70 bn (2025) to USD 11.8 bn (2030) and on toward USD 76.8 bn (2035). But the sector is not one thing: post-quantum cryptography (PQC) compounds at ~49% a year and takes ~92% of the pie by 2035, while quantum key distribution (QKD) grows at only ~6.7%.
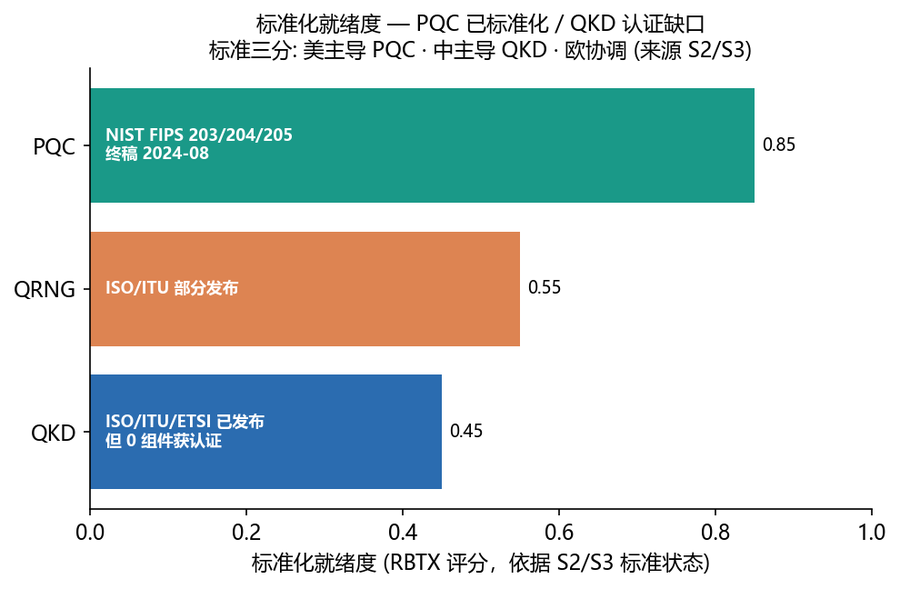
Any “quantum-safe” read that weights QKD and PQC equally is, in our view, an allocation error. The two are a software track and a hardware track on different clocks.
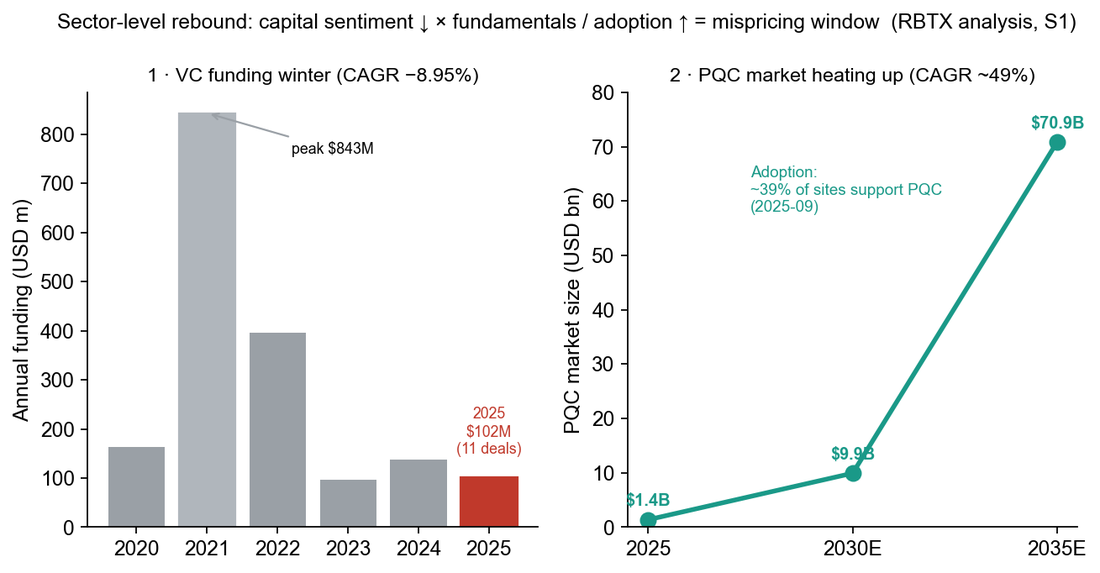
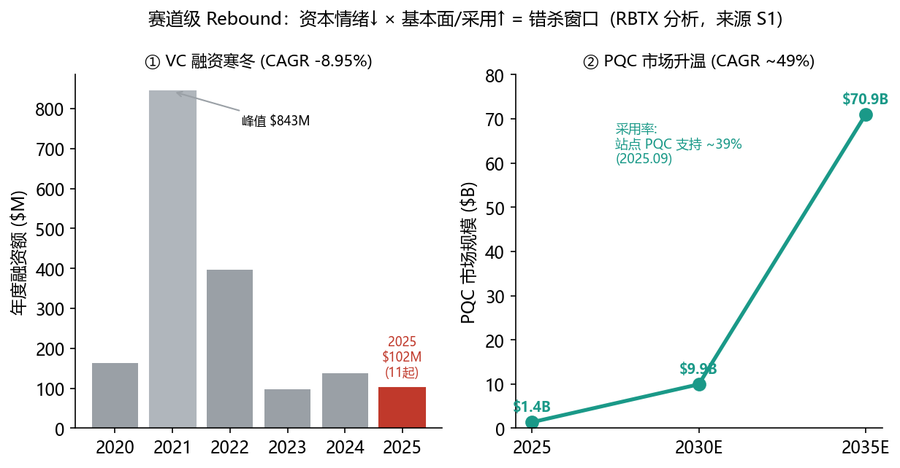
Five years of falling venture funding (CAGR −8.95%) sits directly on top of rising real adoption — about 39% of monitored sites already negotiate PQC, NIST's standards are final, and migration mandates (US OMB M-23-02, EU DORA, NSM-10) are converging.
When fundamentals and capital sentiment diverge this far, the sector tends to re-rate. We read this as a window — and stress-test it with live adoption telemetry rather than treating it as a foregone conclusion.
| Signal | Direction | Evidence |
|---|---|---|
| Capital sentiment | ↓ winter | $843M (2021) → $102M (2025) |
| Fundamentals / adoption | ↑ rising | ~39% sites PQC-ready; FIPS final |
| Migration mandates | ↑ converging | OMB M-23-02 · DORA · NSM-10 |


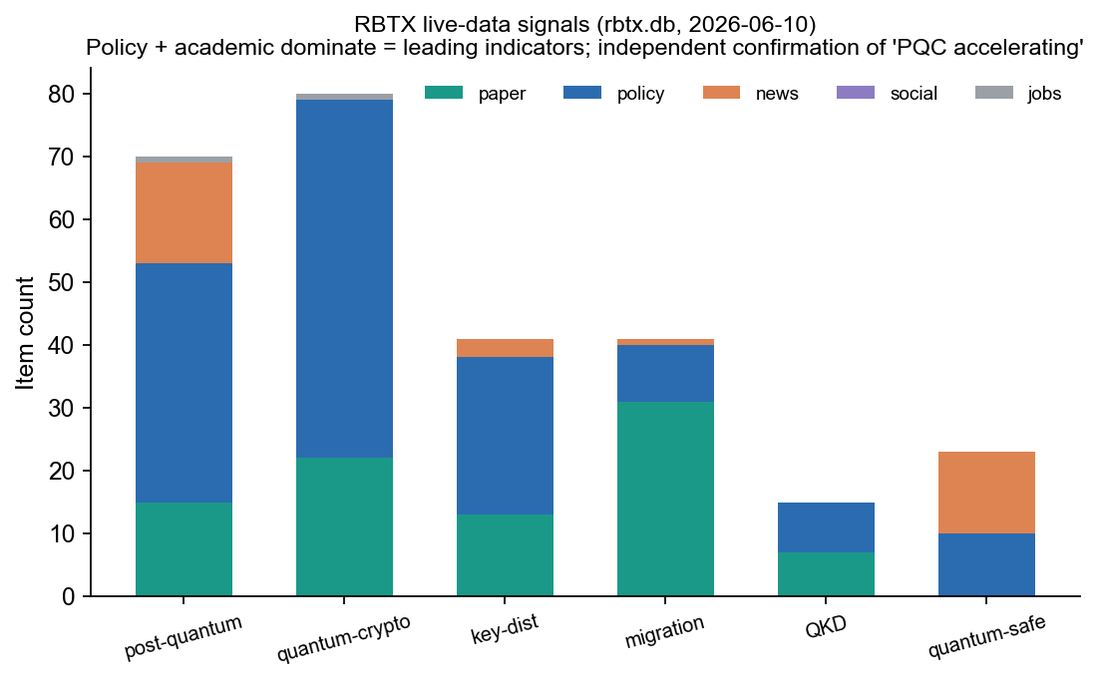
We don't take the industry reports on faith. Querying our own live database directly: 86 post-quantum items, 85 quantum-cryptography items and 42 key-distribution items, plus migration signals — dominated by policy and academic sources, exactly the leading-indicator profile the chain predicts.
Spending records surface real DoD PQC contracts (Post Quantum Labs, Secrecy Labs, Mainsail, Nuts Technologies). The reports say “PQC is accelerating”; our independent live data says the same. That cross-check is what turns an annual snapshot into a monitorable signal.
A forecast you can't audit is an opinion. Signal base as of 2026-07-05.
| # | Prediction | Confidence | Horizon |
|---|---|---|---|
| P1 | PQC decisively outgrows QKD; a sector view should sit ~80% toward PQC. | High | 2025–28 |
| P2 | Value shifts from algorithm IP to the migration / crypto-agility layer. | Med-high | 2025–27 |
| P3 | Sector-level rebound — funding recovers in 12–24 months; today's low is the entry window. Runway is a scored dimension, so the thesis only backs vendors that can reach it. | Medium | 12–24 mo |
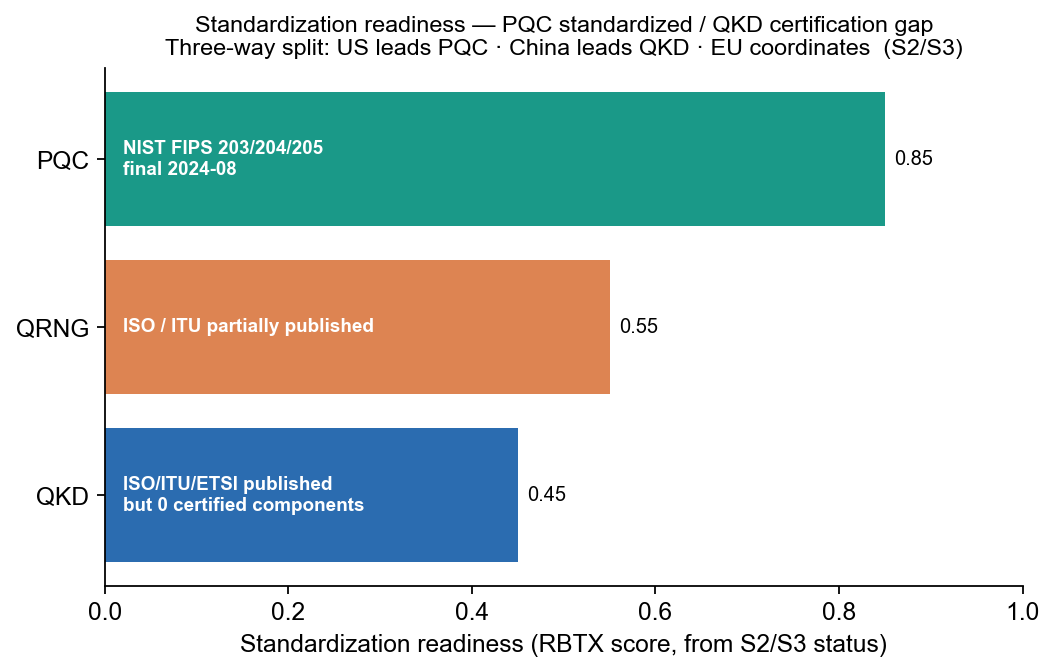
| P4 | QKD stays a China / government-infrastructure niche; the certification gap suppresses Western commercial use. | High | 2025–30 |
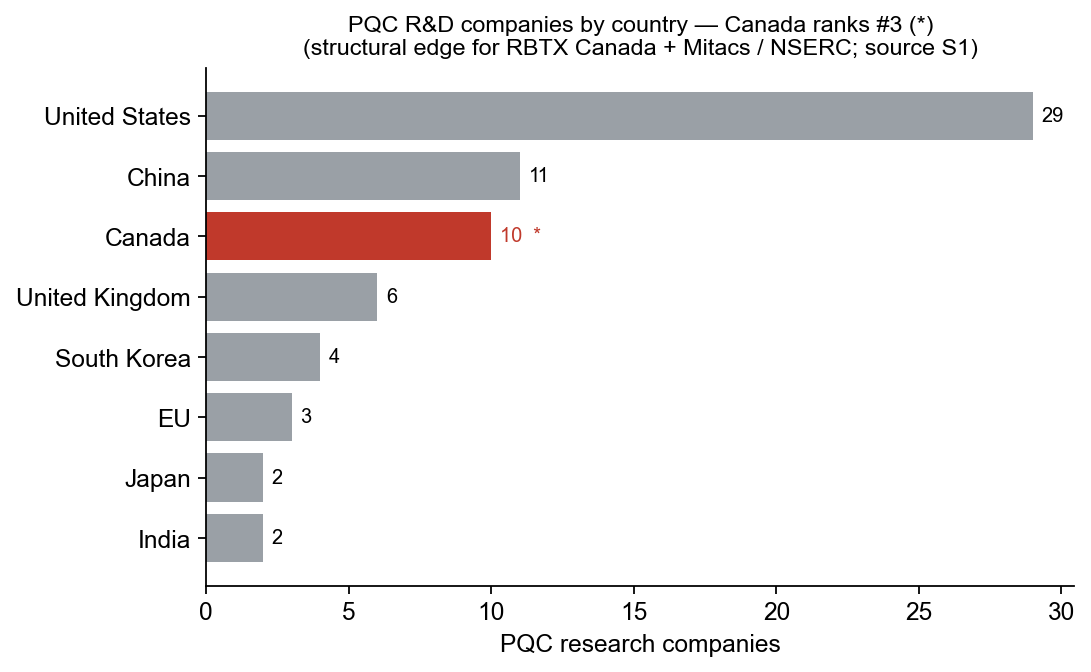
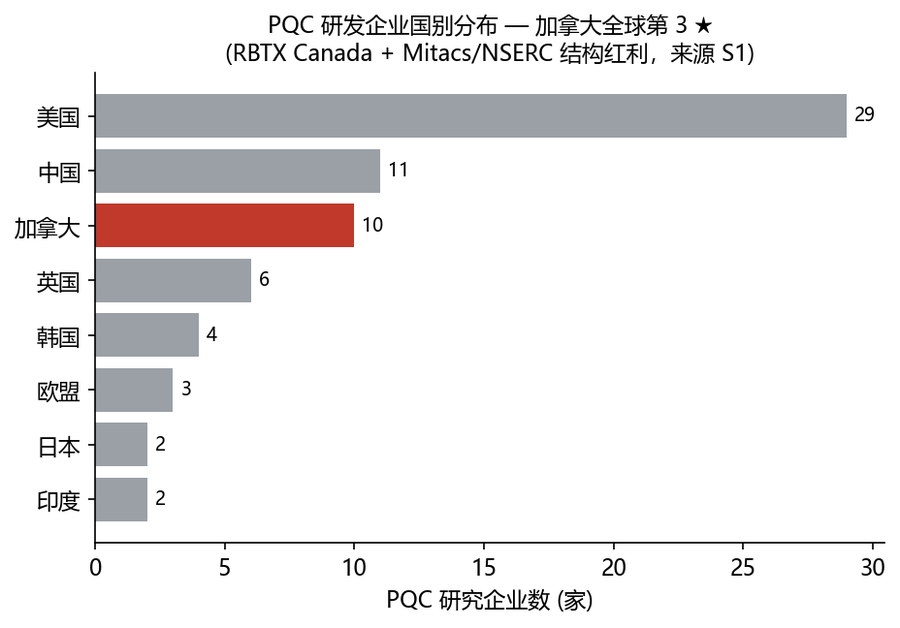
| P5 | Canada's PQC over-index becomes a structural dividend for RBTX Canada (Mitacs / NSERC, Waterloo cluster). | High | Structural |
Confidence and horizon are stated, not implied — and revised as the live data moves. These are sector-level research judgments, not security recommendations.


The English figures above are rebuilt from our original Chinese research charts. The source set, kept in the working language of the RBTX analysis, is shown here for provenance.


Frontier-industry forecasting, by invitation.
contact@zxiaohan.com